Baltic TOP - 2020
Baltic's most valuable enterprises
Discover your company’s value
| TOP 2020 | TOP 2019 | Company name | Value 2020 | Value 2019 | Change | Turnover 2019 | EBITDA 2019 | CorpGov Score | Industry |
|---|---|---|---|---|---|---|---|---|---|
| 10 | 6 | SEB BANK Group 4 | 1150.85 | 1561.60 | -26% | 19355.1 | 2244.1 | 70 | Financial services |
| 9 | 9 | LIETUVOS GELEŽINKELIAI, AB 3 | 1155.39 | 1109.28 | 4% | 473.5 | 185.7 | 90 | Transport, transit, logistics |
| 8 | - | LATVIJAS VALSTS MEŽI, AS 2 | 1159.35 | - | 0% | 375.2 | 157.8 | 57 | Extraction of natural resources |
| 7 | 3 | TALLINK GRUPP, AS | 1194.34 | 1743.06 | -32% | 949.1 | 156.0 | 71 | Transport, transit, logistics |
| 6 | 10 | IGNITIS GRUPE, UAB | 1490.61 | 930.73 | 60% | 1090.6 | 204.6 | 95 | Utility services |
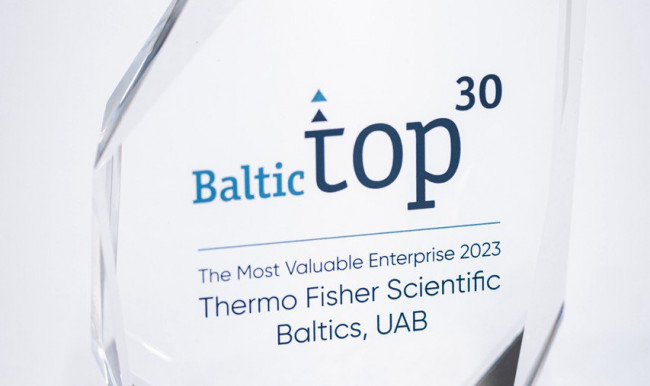
| 5 | 4 | THERMO FISHER SCIENTIFIC BALTICS, UAB | 1528.90 | 1659.46 | -8% | 440.1 | 292.8 | 34 | Manufacturing: consumer goods |
| 4 | 7 | EESTI ENERGIA, AS | 1614.48 | 1261.15 | 28% | 956.4 | 252.5 | 65 | Utility services |
| 3 | 5 | LATVENERGO, AS | 1653.82 | 1568.53 | 5% | 841.6 | 243.9 | 90 | Utility services |
| 2 | 2 | SWEDBANK Group 1 | 1815.87 | 2407.54 | -25% | 28081.2 | 3479.5 | 76 | Financial services |
| 1 | 1 | VILNIAUS PREKYBA, UAB | 3689.11 | 3598.32 | 3% | 4933.5 | 446.3 | 38 | Trade: consumer goods |
* TOP 101 reflects company's enterprise value. With the exception of banks and insurance companies - for these companies equity value is reflected.
** For banks and insurance companies the columns "revenue" and "adjusted EBITDA" present the value of total assets and equity respectively.
1The equity value of SWEDBANK Group is derived by combining the equity values of SWEDBANK Latvia, SWEDBANK Estonia and SWEDBANK Lithuania.
2Latvian state forests.
3Lithuanian Railroad.
4The equity value of SEB BANK Group is derived by combining the equity values of SEB Bank Latvia, SEB Bank Estonia and SEB Bank Lithuania.

Illar Kaasik | Intense Baltic duel: Estonia's most valuable companies collectively outperform Latvia's, but Swedbank's Baltic headquarters, registered in Latvia, is the undisputed leader in the region
View more
At the top of the 2024 Baltic TOP 30 of the most valuable companies – the trio of Lithuanian companies, the leader has changed
View more