
Rollercoaster of SaaS company valuations – back to normal?
Tero Nummenpää
Chairman at Translink Corporate Finance
www.linkedin.com/in/tnummenpaa
tero.nummenpaa@translinkcf.fi
We have seen quite a rollercoaster ride in tech company valuations over the past few years! Let me summarise what I think happened from autumn 2020 to autumn 2021:
- Very low interest rates (0% in many countries) for a long time – making long-term growth look more valuable in DCF valuations. For example, a steady perpetual annual cash flow of 1,000 units is worth 10,000 at a 10% discount rate, but worth 100,000 at a 1% discount rate. And if you add in growth, the difference is even greater!
- Monetary easing has made capital available – not to even mention helicopter money in the US.
- Covid boosted demand and growth and thus the valuations of many SaaS companies that provided tools for working from home (DocuSign, Zoom, among others).
And then, at the end of 2021, everything above changed 180 degrees: higher interest rates, tighter monetary policy and the end of Covid. The result for SaaS company valuations looks like Graph 1 below, where we have utilised our own Translink SaaS Index to show the evolution of SaaS company EV/LTM Sales multiples over time – I think it’s right to call it a rollercoaster?
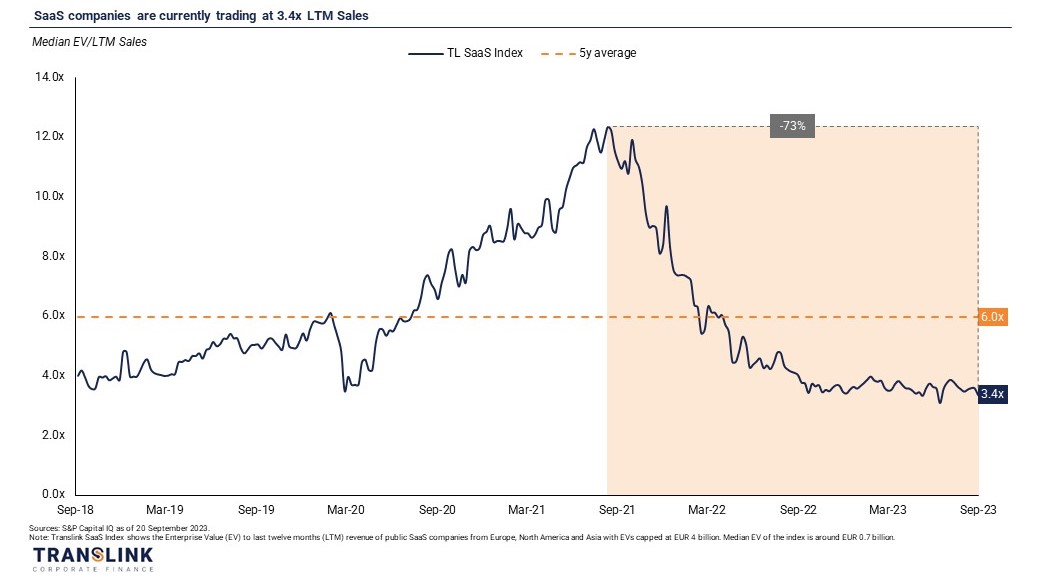
( Graph 1)
Let us divide it into two parts: US vs. Europe. In Graph 2, we can see that primarily the US stocks overreacted the most – leading to almost ridiculous median multiple of up to 22x sales, while in Europe the median peaked at 8x in mid-2021. Although US companies were actually growing faster at the time, I would still put more of the blame on helicopter money for this contrast.
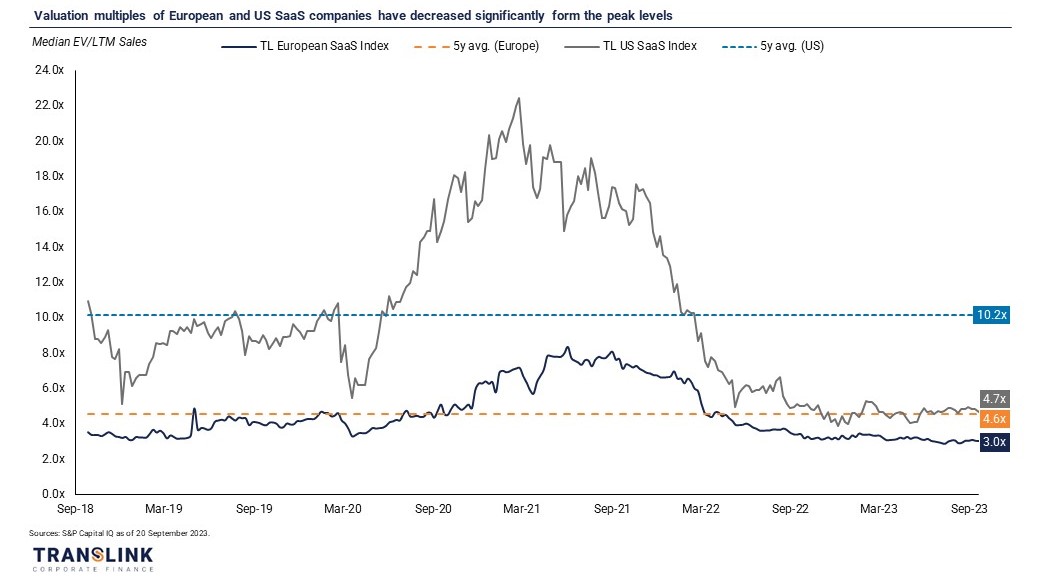
(Graph 2)
At first glance, it looks like we're in terrible market conditions: multiples are well below their five- year averages? Yes, perhaps they are – but if you take the "Covid Boom" out of the average, we can see a different reality. Take a look at Graph 3 below, where we have excluded the Covid Boom period May 2020 - May 2022 from the average calculation.
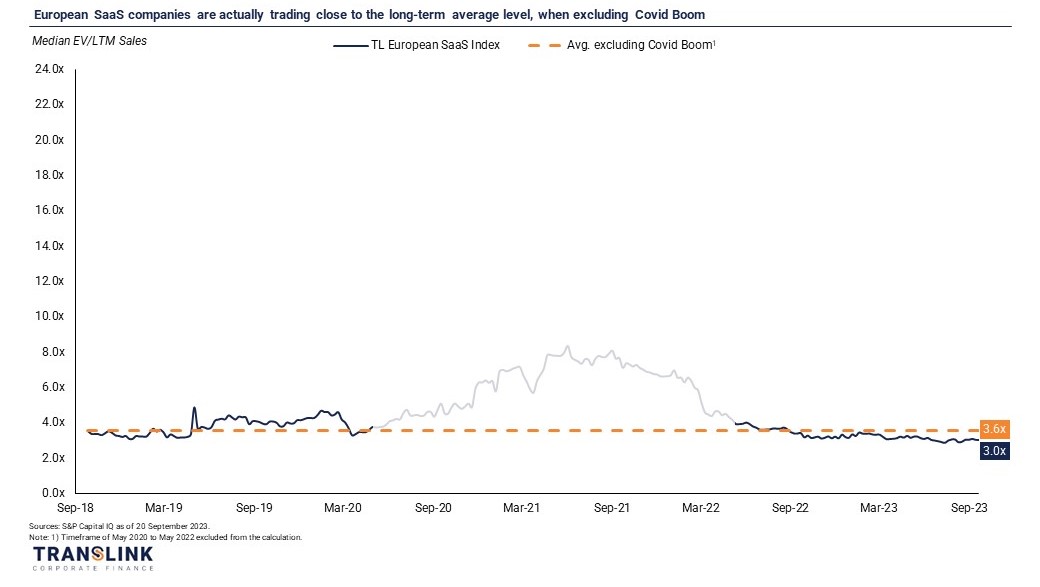
(Graph 3)
Looking at Graph 3, it’s easy to say that we are very close to long-term average valuation multiple. It would be rather optimistic to expect a rapid change to much higher level in the short-term – as long as the interest rates stay in the range of 4-5%, this is probably the right multiple level. The above graphs present only median figures derived from over 130 companies. What does a median mean: half of companies have lower multiples, and the other half has higher multiples. Obviously, each company needs a specific valuation approach that takes into account its business characteristics – in SaaS, this typically means analysis of e.g., growth rates, EBITDA, NRR, CAC/LTV and churn, among other KPIs and business elements.
Let’s dig one step further into the company specific valuation multiples. We see that Rule of 40 (i.e., sum of growth rate of Sales and EBITDA margin) is the most important explanatory factor for valuation multiples. Graph 4 shows how the companies in our Translink SaaS Index are spread when plotting valuation multiples based on Rule of 40. You can easily see the correlation being positive between EV/Sales multiple and Rule of 40. Please note, that in this graph the EV/Sales multiple and Rule of 40 are based on 2023 estimates (i.e., forward looking).
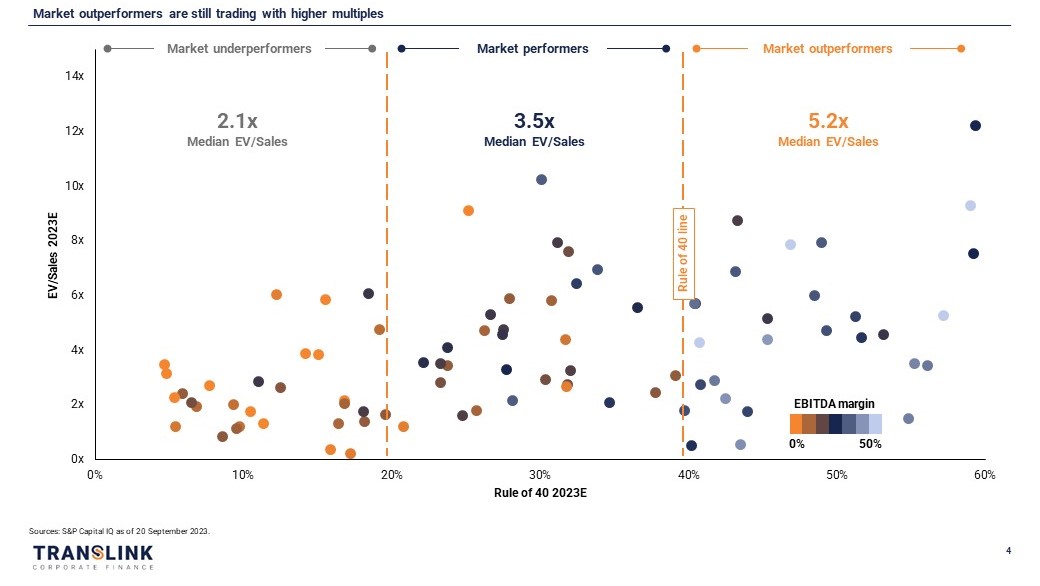
(Graph 4)
It was mentioned earlier that higher interest rates mean less value for future cash flows. In Graph 4 we have used different colours for companies depending on their EBITDA margin. Looking at the colours, it’s obvious that most of the Market Outperformers have higher profitability, thus higher multiples. This was not the case in 2021 – quite the opposite since high growth was very much appreciated. Also, the estimated growth rates are now also much lower than at the peak of the market.
And while the weight put on growth profile may be lower than back in 2021, there is still a huge difference in the multiples if a company is growing at 5% or 50% per annum. We are very happy to see that some Estonian tech companies are still posting such high growth numbers! All in all, we are back to normal in all respects: Median multiples for tech companies are at long-term averages, yet great companies still have high multiples!
A quick note on our Translink SaaS Index – and why it’s different from many other indices. As we do mid-sized deals (Enterprise Value of EUR 10-200 million instead of billions), we have put more weight on smaller companies in our SaaS Index. We also have more than 35% weight in the Nordic countries, 25% in the rest of Europe, only 30% in the US and around 10% in other markets. This is because we have excluded very large cap companies from the sample. We believe that our Translink SaaS Index is a better valuation proxy for our typical transactions – in our core European markets.